The Affordable Care Act (ACA), also known as Obamacare, was signed into law in 2010 to expand healthcare access for millions of Americans. But how is the Affordable Care Act funded? This guide breaks down ACA funding mechanisms, including taxes, Medicare savings, and general revenues, while addressing shortfalls, long-term sustainability, and its place in broader economic models like capitalism, socialism, and free-market systems. With federal debt reaching $35.5 trillion in 2025 and ongoing deficits, understanding Affordable Care Act (ACA) costs is crucial. We’ll explore official CBO projections, alternative estimates, and indirect impacts from inflation and monetary policy to provide a balanced view.
The ACA’s Original Funding Vision and Current Challenges
When enacted, the Affordable Care Act aimed for fiscal neutrality, projecting $788 billion in gross costs from 2010–2019, offset by new revenues and Medicare reforms. Key funding came from taxes on high-income earners, penalties, and efficiency measures. However, repeals—like the individual mandate penalty in 2019 and the medical device tax in 2020—have slashed revenues by $14–$26 billion annually, increasing reliance on general revenues and borrowing.
In 2025, annual ACA costs range from $130–$150 billion, with 40–50% covered by general revenues (including 11–15% from borrowing). The Congressional Budget Office (CBO) maintains deficit neutrality, but alternative analyses, such as those from the Mercatus Center, estimate an additional $131 billion in deficits from 2015–2024 due to underestimated Medicaid expenses.
Indirect Economic Impacts on ACA Funding
While not solely attributable to the Affordable Care Act, its status as a major mandatory spending program (10–15% of the federal budget) contributes to fiscal pressures. High deficits ($1.8–$2 trillion in 2025) drive up interest rates, adding 1–2% to borrowing costs for healthcare providers, which can inflate premiums. Inflation from monetary policy erodes real savings, with Medicare funds losing 2–3% in purchasing power yearly.
Comparing economic models:
- Socialism (e.g., Medicare for All): Could cost $32.6–$34 trillion over 10 years (Mercatus and Urban Institute estimates), with administrative savings reducing overhead from 12% to 2–6%, but shifting burdens to federal outlays.
- Capitalism (ACA’s mixed system): Expanded coverage to 20 million but leaves 28 million underinsured, resulting in $40–$45 billion in uncompensated care annually (CMS data).
- Free-Market Capitalism: Deregulation could save $400–$450 billion yearly through competition, like 10% premium reductions in cross-state markets (RAND studies), though it risks higher underinsurance.
Breaking Down How the Affordable Care Act (ACA) Is Funded: Key Mechanisms and Data
Understanding Affordable Care Act funding sources requires examining dedicated revenues, savings, and subsidies. Here’s a detailed breakdown based on 2025 projections from sources like the CBO, CMS, and IRS.
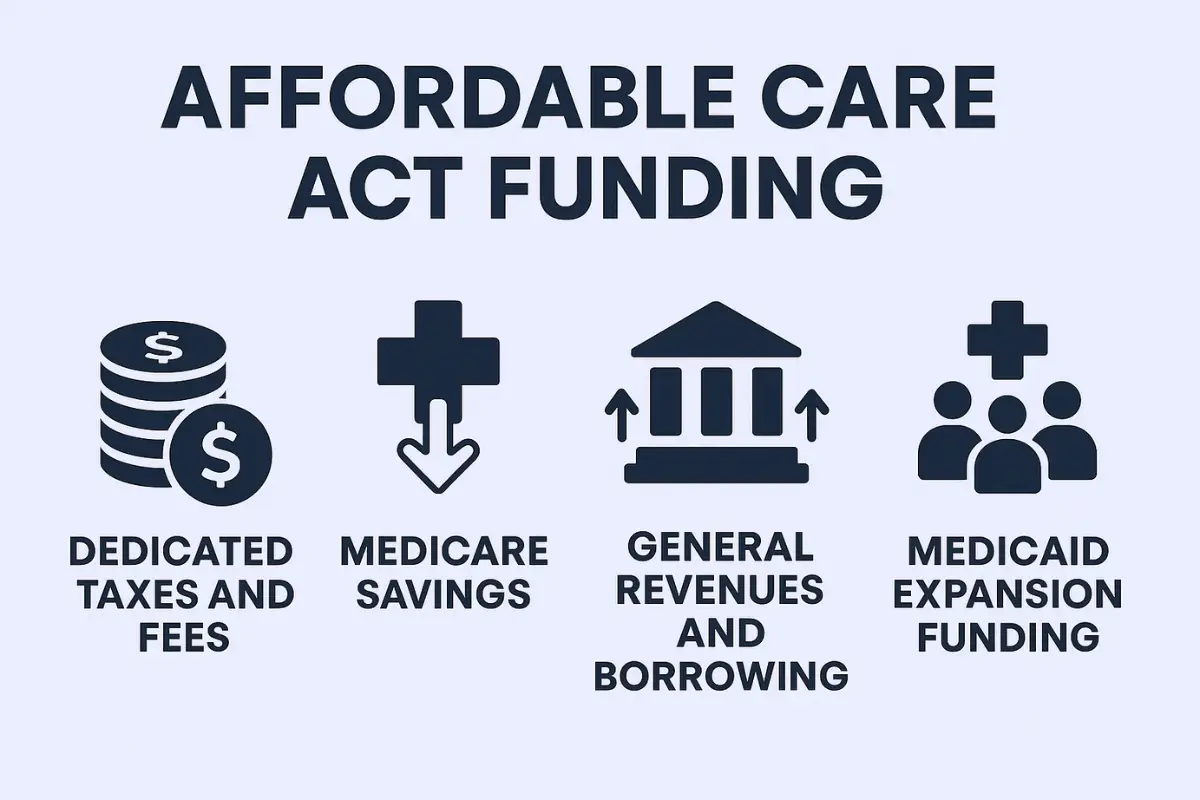
1. Dedicated Taxes and Fees ($30–$40 Billion Annually)
These form the core of Affordable Care Act (ACA)-specific revenues:
- High-Income Taxes: $30–$35 billion from surcharges on earnings over $200,000 (IRS data).
- Pharmaceutical Fees: $2.5–$4 billion imposed on drug manufacturers.
- Employer Mandate Penalties: $5–$10 billion for non-compliant businesses.
- Repealed Taxes: Losses of $14–$26 billion/year from eliminated provisions like the Cadillac tax.
- Other Minor Taxes: $1–$2 billion from various fees.
2. Medicare Savings ($50–$70 Billion Annually)
The Affordable Care Act projected $700 billion in cumulative savings from 2010–2019 through provider payment cuts, reducing growth from 6–7% pre-ACA to 4% annually. Actual savings have reached $1–$1.5 trillion below baselines (CMS). However, early CBO estimates underestimated Medicaid costs by 20–50% in some states. Indirectly, deficit-driven interest adds $0.73–$1.09 billion in erosion.
3. General Revenues and Borrowing ($52–$75 Billion, or 40–50% of Total Costs)
This covers marketplace subsidies ($60 billion/year) and the federal Medicaid share ($60–$70 billion). While CBO views it as neutral, rising debt could add $22 trillion by 2035. Monetary policy shifts, like the 2025 Fed funds rates at 4–5%, increase national debt service by 1–2%, pressuring healthcare budgets.
4. Medicaid Expansion Funding
Federal funding supports $60–$70 billion for 20 million enrollees. Alternatives like Health Savings Accounts (HSAs) in free-market models could save $190 billion over a decade (Heritage Foundation). Deficit spending may crowd out private investment, raising provider costs by 5–10% (GAO estimates).
Underinsured Costs and Coverage Gaps
Pre-ACA uncompensated care was $50–$60 billion; post-ACA, it’s $40–$45 billion, but 28 million underinsured face $1,500–$2,000 in extra annual expenses (KFF data).
Official Sources and Alternative Projections for ACA Funding
- Peterson Foundation: $91 billion in subsidies for 2023.
- MACPAC: Medicaid per-enrollee cost at $5,669.
- CBO and HHS: Core Affordable Care Act reports and provisions.
- Commonwealth Fund: Coverage gains analysis. Limitations include CBO baselines overlooking debt impacts. Alternatives:
- Mercatus: $32.6 trillion for Medicare for All.
- RAND: 10–20% savings from deregulation.
- Urban Institute: $34 trillion for universal coverage.
The Role of Cost-Sharing Reductions and Premium Tax Credits in ACA Spending
In 2025, cost-sharing reductions (CSRs) and premium tax credits (PTCs) remain two of the largest individual-level subsidies under the Affordable Care Act. Together, they represent approximately $90–$100 billion in annual expenditures, with PTCs accounting for nearly $70 billion and CSRs costing an estimated $20–$30 billion. These subsidies lower out-of-pocket expenses and monthly premiums for enrollees earning between 100% and 400% of the federal poverty level—a group that comprises over 80% of those enrolled in ACA marketplaces.
The 2021 American Rescue Plan temporarily expanded PTC eligibility and increased subsidy amounts, and while some provisions expired, others were extended through the Inflation Reduction Act, shaping 2025 cost projections. Critics argue that this structure creates “benefit cliffs,” where a modest income increase can trigger a steep drop in subsidy value. This volatility can lead to coverage churn, which undermines healthcare continuity and increases administrative costs.
Despite CBO estimates showing these subsidies help reduce overall healthcare costs by encouraging preventive care use, concerns persist over their long-term affordability. If ACA enrollment grows or inflation continues at 3–4%, total subsidy costs could rise 10–15% annually, according to Urban Institute forecasts. Adjusting subsidy formulas or implementing a cap on maximum federal contributions are among the reforms proposed to preserve the Affordable Care Act’s fiscal integrity.
State-Level Variations and Fiscal Pressures from Medicaid Expansion
As of 2025, 39 states and Washington D.C. have adopted Medicaid expansion, allowing low-income adults earning up to 138% of the federal poverty level to qualify. While the federal government covers 90% of these costs, states are still responsible for the remaining 10% share, amounting to $7–$9 billion annually nationwide. States like Texas and Florida, which have not expanded Medicaid, continue to experience higher uncompensated care rates—nearly 20% above the national average (KFF).
For expansion states, Medicaid growth has strained local budgets, especially in areas with stagnant tax revenues or declining populations. For instance, West Virginia and Mississippi have reported budget reallocations from infrastructure and education to cover rising Medicaid costs. Moreover, Medicaid’s open-ended structure means costs grow with enrollment and healthcare inflation, exposing states to fiscal unpredictability.
Some policy experts have floated block grants or per-capita caps as ways to contain Medicaid growth, but critics warn these could reduce coverage or shift costs to hospitals. Still, targeted reforms—like integrating managed care or incentivizing value-based care—could save 5–8% in state expenditures without compromising access. Aligning Medicaid policies with local economic conditions will be crucial to maintaining both coverage and fiscal responsibility.
Conclusion: Balancing Affordable Care Act Sustainability with Economic Trade-Offs
The Affordable Care Act has achieved coverage expansions, reducing uncompensated care from $50–$60 billion pre-ACA to $40–$45 billion today, but at $200–$230 billion in new annual spending. With U.S. debt-to-GDP projected at 140% by 2035 and inflation eroding savings by 2–3%, long-term viability is challenged. Compared to international models:
- Taiwan/Canada (universal systems): $5,000–$7,000 per capita vs. U.S. $12,900, with lower administrative waste but potential wait times. Socialist approaches like Medicare for All offer equity but higher outlays ($32–$34 trillion over 10 years). Free-market options promise $400–$450 billion in annual savings through efficiencies, as seen in Singapore (8% GDP spending) or pre-1965 U.S. (5–6% GDP). Hybrids incorporating HSAs ($190 billion savings) or price controls could optimize in high-debt scenarios. Policymakers must evaluate these for fiscal resilience.
This guide to how the Affordable Care Act is funded provides actionable insights for 2025. For more on ACA costs and reforms, explore related topics like Obamacare subsidies or healthcare sustainability.